The tutorial contains the following sections:
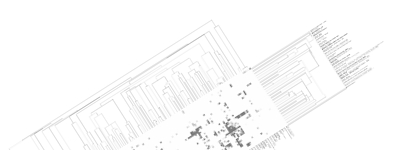
Below you can find an explanation for the different uses of this site. Traits Using published data we have compiled the average traits (signs, symptoms, laboratory findings etc.) seen in mitochondrial diseases. By clicking "Show diseases and traits" you can see the average traits seen in mitochondrial diseases and a list of diseases in the database. 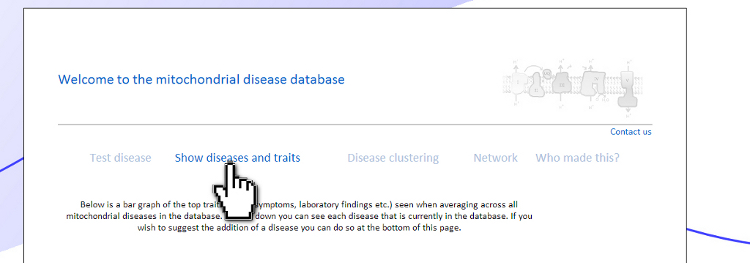 Under the "Show diseases and traits" tab you will see the top-20 traits seen in mitochondrial diseases. If you wish to see all the traits you can click the links below the top-20 image. 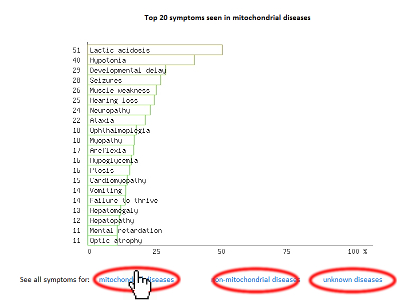 Below the image of the top-20 symptoms you will see the list of diseases in the database. The diseases have been categorized as mitochondrial, non-mitochondrial or diseases not strictly mitochondrial or non-mitochondrial. If you wish to further investigate a particular diseases you can push the "Show" button to see the details regarding this disease. 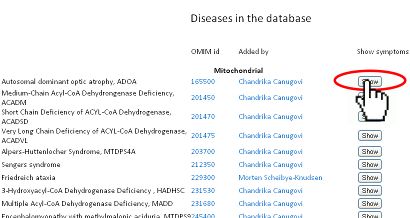 Pushing the "Show" button will allow you to see the traits for that particular disease. The bar graph represents the average prevalence of the traits in the disease. 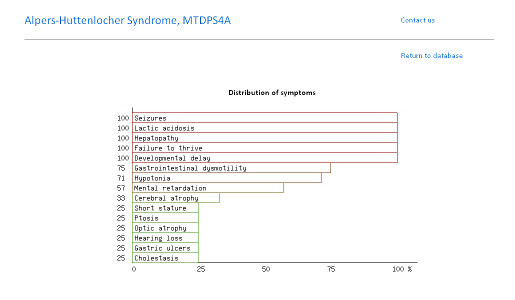 Below the bar graph you will see the form if you wish to submit a new trait to the disease. You need to fill out all parts of the form. 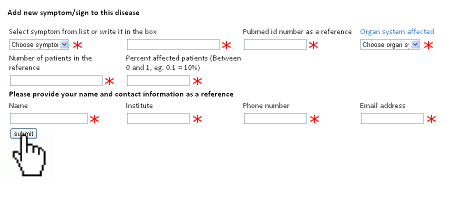 Below the list of diseases in the "Show diseases and traits" tab you can find the form that you can use if you wish to suggest the addition of a new disease to the database. Simply fill out the form and click the submit button. Each part of the form must be filled out. After you have clicked submit we will review the suggestions and either accept the changes or contact you to discuss your suggestions. 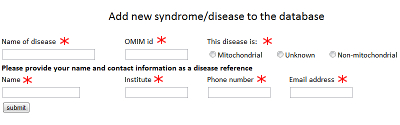 Below the form you will see the export function where you can export the database to an excel sheet. If you wish to do clustering we suggest choosing the export for clustering option. 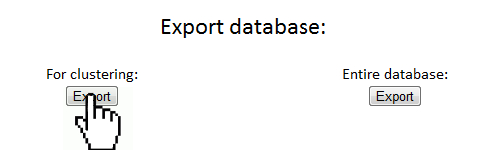 The disease network By selecting the Network tab you will be able to see how all the diseases in the database are associated. Each dot represents a disease and the connecting lines represents shared traits. The shorter, darker and thicker the line the more traits are shared. You can see the equation used here. If you move your mouse over a dot you will be able to see the other connected diseases. Various thresholds can be chosen to only consider two diseases connected if they share a substantial overlap. The thresholds represents are 10%, 20%, 50% and 100%. A cutoff of 10% Indicates that the trait that is connecting the diseases is seen in 10% of both diseases or 1% in one and 100% in the other. 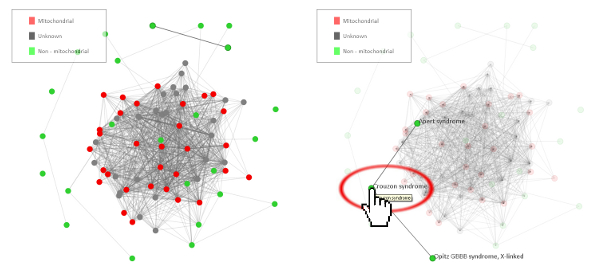 Please see an example of the network below on a small number of diseases. Each dots represents a disease and the connecting lines a the symptoms that connect the diseases. The darker and thicker the line the more features the two diseases share. Hold the mouse pointer over each dot to see the name of the disease and the connection for that disease. The network is best shown in the Google Chrome browser. Threshold level: Test disease In the following section we will go through how to test a disease for possible mitochondrial involvement. You can test a disease in the "Test disease" tab as shown below. 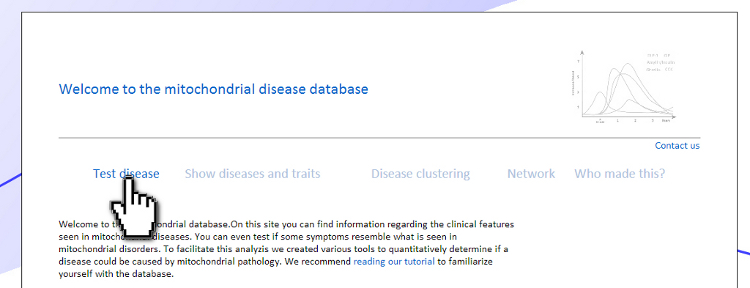 You will now see a form that you need to fill out. You can choose to either put in a new disease or test a disease from the list of diseases already in the database. If you test a disease from the list, simply choose it and click "Test Disease". 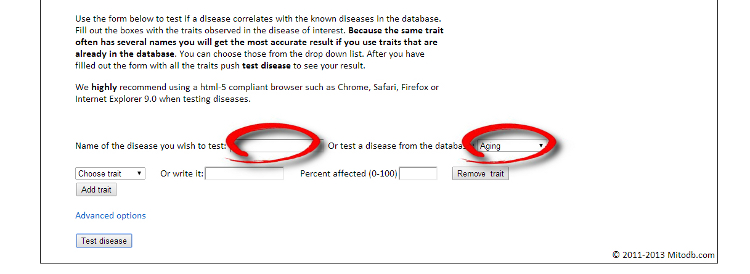 Let us test a new disease. To begin, fill in a name of the disease you wish to test. The name is used only for your own information. The calculation will only use the traits that you subsequently enter. After you have written the disease name you now have to choose the traits. We highly recommend only using traits that are already in the database, since we are only able to do calculations with these traits. Some traits may have multiple names so please check all the possible names for that particular trait. After you have filled out the name of the disease you need to fill out the percentage of people affected. If you are testing a single person you should put in 100 or if you think the traits is not particularly strong you can put in a lower number. You can now add more traits to the disease. 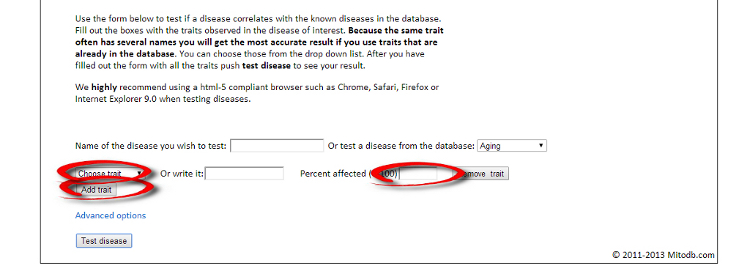 When you are done you push "Test disease". 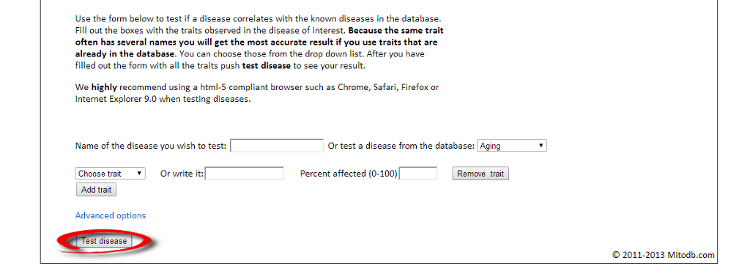 If you wish to change the algorithm with which the different values are calculated you can push "Advanced options". We recommend, however, to use the default settings since these have been shown to yield the best results. 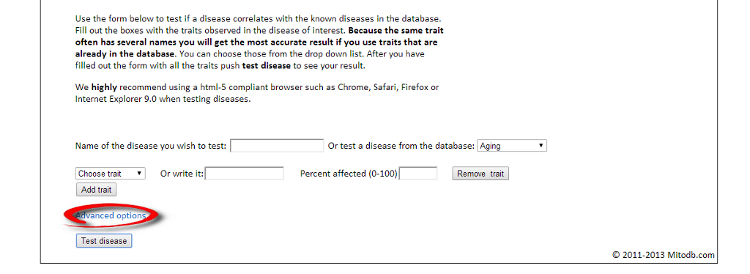 Interpreting your results After you have submitted your disease you will now be guided to the result page. To get the nicest graphical representation we recommend using HTML-5 complient browsers such as Chrome, Safari or Firefox. Internet Explorer is unfortunately not compatible with many of the algorithms. Support vector machine The support vector machine is a machine learning algorithm. This basically means that we have taught the computer what traits are commonly seen in mitochondrial diseases and in non-mitochondrial diseases. The computer then predicts if the disease tested is mitochondrial by assigning a score to the disease. A positive score means it is more mitochondrial while a negative score means it is more non-mitochondrial. You can learn more about Support Vector Machines here. You can click on the value to see how the disease scores compared to all the diseases in the database. 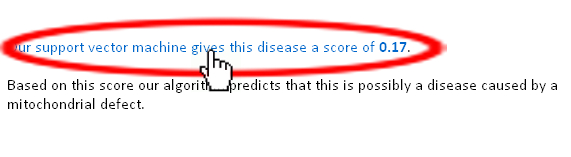 Hierarchical cluster The first image you will get to is the image of the circular hierarchical cluster dendrogram. This dendrogram will show you how the diseases correlate with each other based on their traits. The shorter the distance between two diseases the shorter the leg of the dendrogram. Read more about hierarchical clustering here. 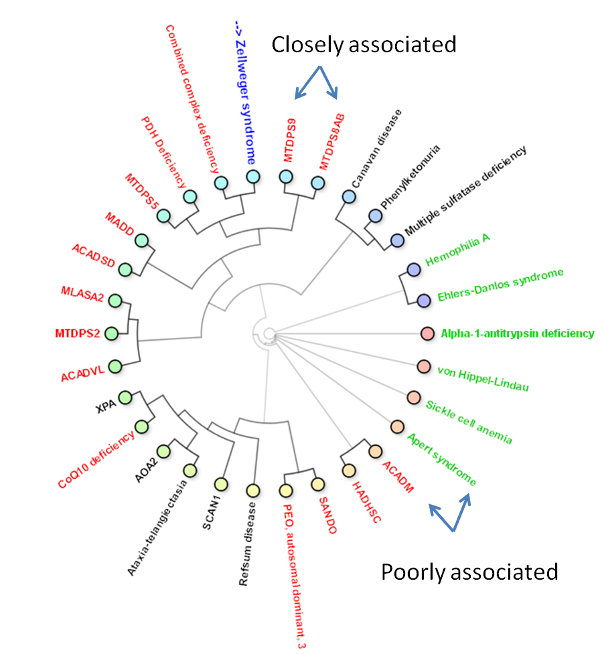 The red colored diseases are the known mitochondrial diseases, the green are the non-mitochondrial, the black are diseases of unknown etiology and the blue is the disease you tested. The mito-score and mitochondrial barcode When clicking on the "Barcode"-tab you will be able to investigate what other diseases in the database share traits with the disease you tested. At the top you will see if some of the traits entered are not found in other diseases. 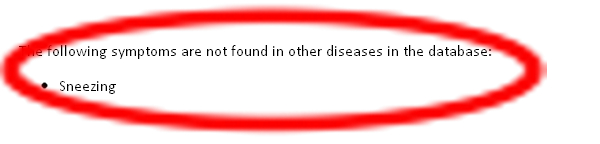 Below this you will find a list that tells you how many diseases have shared traits. The list is constructed so that diseases that share one trait, two traits, three traits etc. will be displayed sequentially. You can therefore use this list to find diseases that have the largest overlap in traits with the disease you are testing. 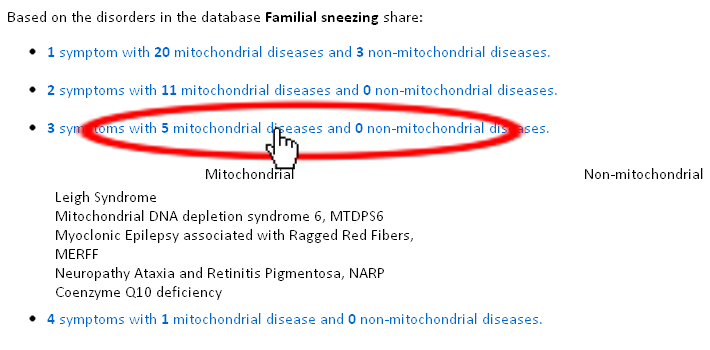 Underneath the list you will find the mito-score. The score is a measurement of how each trait in the disease scores compared to traits in mitochondrial and non-mitochondrial diseases in the database. A score above 50 means that the disease shares more similarities with mitochondrial diseases than non-mitochondrial diseases. If you wish to know the mathematics behind the score you can click on How is this generated? 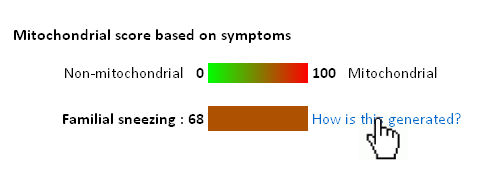 The last piece of information is the mitochondrial barcode. This is a graphical representation of how the disease correlates with other diseases in the database. Each bar in the barcode represents a seperate disease within the database. The color of the bar represents whether the disease is mitochondrial (red), non-mitochondrial (green) or of unknown etiology (blue). The tint of the bar represents the strength of the correlation. It is calculated as the prevalence of the trait in the disease tested multiplied with the prevalence of the trait in that particular disease. Thus, the maximal strength will be when 100% of patients show the particular trait in the disease tested as well as in the disease represented by the bar. 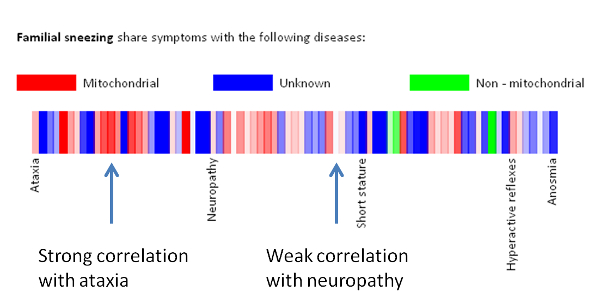 Below the barcode you can see what disease each bar represents. |